Practical fault detection & alerting. You don't need to be a data scientist
As we try to retain visibility into our increasingly complicated applications and infrastructure, we're building out more advanced monitoring systems. Specifically, a lot of work is being done on alerting via fault and anomaly detection. This post covers some common notions around these new approaches, debunks some of the myths that ask for over-complicated solutions, and provides some practical pointers that any programmer or sysadmin can implement that don't require becoming a data scientist.
It's not all about math
I've seen smart people who are good programmers decide to tackle anomaly detection on their timeseries metrics.
(anomaly detection is about building algorithms which spot "unusual" values in data, via statistical frameworks). This is a good reason to brush up on statistics, so you can apply some of those concepts.
But ironically, in doing so, they often seem to think that they are now only allowed to implement algebraic mathematical formulas. No more if/else, only standard deviations of numbers. No more for loops, only moving averages. And so on.
When going from thresholds to something (anything) more advanced, suddenly people only want to work with mathematical formula's. Meanwhile we have entire Turing-complete programming languages available, which allow us to execute any logic, as simple or as rich as we can imagine. Using only math massively reduces our options in implementing an algorithm.
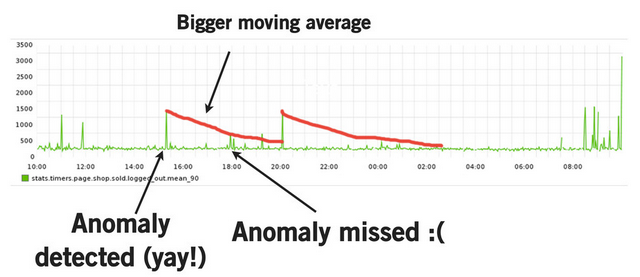
For example I've seen several presentations in which authors demonstrate how they try to fine-tune moving average algorithms and try to get a robust base signal to check against but which is also not affected too much by previous outliers, which raise the moving average and might mask subsequent spikes).
 from A Deep Dive into Monitoring with Skyline
But you can't optimize both, because a mathematical formula at any given point can't make the distinction between past data that represents "good times" versus "faulty times".
However: we wrap the output of any such algorithm with some code that decides what is a fault (or "anomaly" as labeled here) and alerts against it, so why would we hold ourselves back in feeding this useful information back into the algorithm?
I.e. assist the math with logic by writing some code to make it work better for us: In this example, we could modify the code to just retain the old moving average from before the time-frame we consider to be faulty. That way, when the anomaly passes, we resume "where we left off". For timeseries that exhibit seasonality and a trend, we need to do a bit more, but the idea stays the same. Restricting ourselves to only math and statistics cripples our ability to detect actual faults (problems).
Another example: During his Monitorama talk, Noah Kantrowitz made the interesting and thought provoking observation that Nagios flap detection is basically a low-pass filter. A few people suggested re-implementing flap detection as a low-pass filter. This seems backwards to me because reducing the problem to a pure mathematical formula loses information. The current code has the high-resolution view of above/below threshold and can visualize as such. Why throw that away and limit your visibility?
Unsupervised machine learning... let's not get ahead of ourselves.
Etsy's Kale has ambitious goals: you configure a set of algorithms, and those algorithms get applied to all of your timeseries. Out of that should come insights into what's going wrong. The premise is that the found anomalies are relevant and indicative of faults that require our attention.I have quite a variety amongst my metrics. For example diskspace metrics exhibit a sawtooth pattern (due to constant growth and periodic cleanup), crontabs cause (by definition) periodic spikes in activity, user activity causes a fairly smooth graph which is characterized by its daily pattern and often some seasonality and a long-term trend.

Because they look differently, anomalies and faults look different too. In fact, within each category there are multiple problematic scenarios. (e.g. user activity based timeseries should not suddenly drop, but also not be significantly lower than other days, even if the signal stays smooth and follows the daily rhythm)
I have a hard time believing that running the same algorithms on all of that data, and doing minimal configuration on them, will produce meaningful results. At least I expect a very low signal/noise ratio. Unfortunately, of the people who I've asked about their experiences with Kale/Skyline, the only cases where it's been useful is where skyline input has been restricted to a certain category of metrics - it's up to you do this filtering (perhaps via carbon-relay rules), potentially running multiple skyline instances - and sufficient time is required hand-selecting the appropriate algorithms to match the data. This reduces the utility.
"Minimal configuration" sounds great but this doesn't seem to work.
Instead, something like Bosun (see further down) where you can visualize your series, experiment with algorithms and see the results in place on current and historical data, to manage alerting rules seems more practical.
Some companies (all proprietary) take it a step further and pay tens of engineers to work on algorithms that inspect all of your series, classify them into categories, "learn" them and automatically configure algorithms that will do anomaly detection, so it can alert anytime something looks unusual (though not necessarily faulty). This probably works fairly well, but has a high cost, still can't know everything there is to know about your timeseries, is of no help if your timeseries is behaving faulty from the start and still alerts on anomalous, but irrelevant outliers.
I'm suggesting we don't need to make it that fancy and we can do much better by injecting some domain knowledge into our monitoring system:
- using minimal work of classifying metrics via metric meta-data or rules that parse metric id's, we can automatically infer knowledge of how the series is supposed to behave (e.g. assume that disk_mb_used looks like sawtooth, frontend_requests_per_s daily seasonal, etc) and apply fitting processing accordingly.
Any sysadmin or programmer can do this, it's a bit of work but should make a hands-off automatic system such as Kale more accurate.
Of course, adopting metrics 2.0 will help with this as well. Another problem with machine learning is they would have to infer how metrics relate against each other, whereas with metric metadata this can easily be inferred (e.g.: what are the metrics for different machines in the same cluster, etc) - hooking into service/configuration management: you probably already have a service, tool, or file that knows how your infrastructure looks like and which services run where. We know where user-facing apps run, where crontabs run, where we store log files, where and when we run cleanup jobs. We know in what ratios traffic is balanced across which nodes, and so on. Alerting systems can leverage this information to apply better suited fault detection rules. And you don't need a large machine learning infrastructure for it. (as an aside: I have a lot more ideas on cloud-monitoring integration)
- Many scientists are working on algorithms that find cause and effect when different series exhibit anomalies, so they can send more useful alerts. But again here, a simple model of the infrastructure gives you service dependencies in a much easier way.
- hook into your event tracking. If you have something like anthracite that lists upcoming press releases, then your monitoring system knows not to alert if suddenly traffic is a bit higher. In fact, you might want to alert if your announcement did not create a sudden increase in traffic. If you have a large scale infrastructure, you might go as far as tagging upcoming maintenance windows with metadata so the monitoring knows which services or hosts will be affected (and which shouldn't).
Anomaly detection is useful if you don't know what you're looking for, or providing an extra watching eye on your log data. Which is why it's commonly used for detecting fraud in security logs and such. For operational metrics of which admins know what they mean, should and should not look like, and how they relate to each other, we can build more simple and more effective solutions.
The trap of complex event processing... no need to abandon familiar tools
On your quest into better alerting, you soon read and hear about real-time stream processing, and CEP (complex event processing) systems. It's not hard to be convinced on their merits: who wouldn't want real-time as-soon-as-the-data-arrives-you-can-execute-logic-and-fire-alerts?They also come with a fairly extensive and flexible language that lets you program or compose monitoring rules using your domain knowledge. I believe I've heard of storm for monitoring, but Riemann is the best known of these tools that focus on open source monitoring. It is a nice, powerful tool and probably the easiest of the CEP tools to adopt. It can also produce very useful dashboards. However, these tools come with their own API or language, and programming against real-time streams is quite a paradigm shift which can be hard to justify. And while their architecture and domain specificity works well for large scale situations, these benefits aren't worth it for most (medium and small) shops I know: it's a lot easier (albeit less efficient) to just query a datastore over and over and program in the language you're used to. With a decent timeseries store (or one written to hold the most recent data in memory such as carbonmem) this is not an issue, and the difference in timeliness of alerts becomes negligible!
An example: finding spikes
Like many places, we were stuck with static thresholds, which don't cover some common failure scenarios. So I started asking myself some questions:how does that look like in the data, and what's the simplest way I can detect each scenario?
Our most important data falls within the user-driven category from above where various timeseries from across the stack are driven by, and reflect user activity. And within this category, the most common problem (at least in my experience) is spikes in the data. I.e. a sudden drop in requests/s or a sudden spike in response time. As it turned out, this is much easier to detect than one might think:

In this example I just track the standard deviation of a moving window of 10 points. Standard deviation is simply a measure of how much numerical values differ from each other. Any sudden spike bumps the standard deviation. We can then simply set a threshold on the deviation. Fairly trivial to set up, but has been highly effective for us.
You do need to manually declare what is an acceptable standard deviation value to be compared against, which you will typically deduce from previous data. This can be annoying until you build an interface to speed up, or a tool to automate this step.
In fact, it's trivial to collect previous deviation data (e.g. from the same time of the day, yesterday, or the same time of the week, last week) and automatically use that to guide a threshold. (Bosun - see the following section - has "band" and "graphiteBand" functions to assist with this). This is susceptible to previous outliers, but you can easily select multiple previous timeframes to minimize this issue in practice.
it-telemetry thread
So without requiring fancy anomaly detection, machine learning, advanced math, or event processing, we are able to reliably detect faults using simple, familiar tools. Some basic statistical concepts (standard deviation, moving average, etc) are a must, but nothing that requires getting a PhD. In this case I've been using Graphite's stdev function and Graph-Explorer's alerting feature to manage these kinds of rules, but it doesn't allow for a very practical iterative workflow, so the non-trivial rules will be going into Bosun.
BTW, you can also use a script to query Graphite from a Nagios check and do your logic
Workflow is key. A closer look at bosun
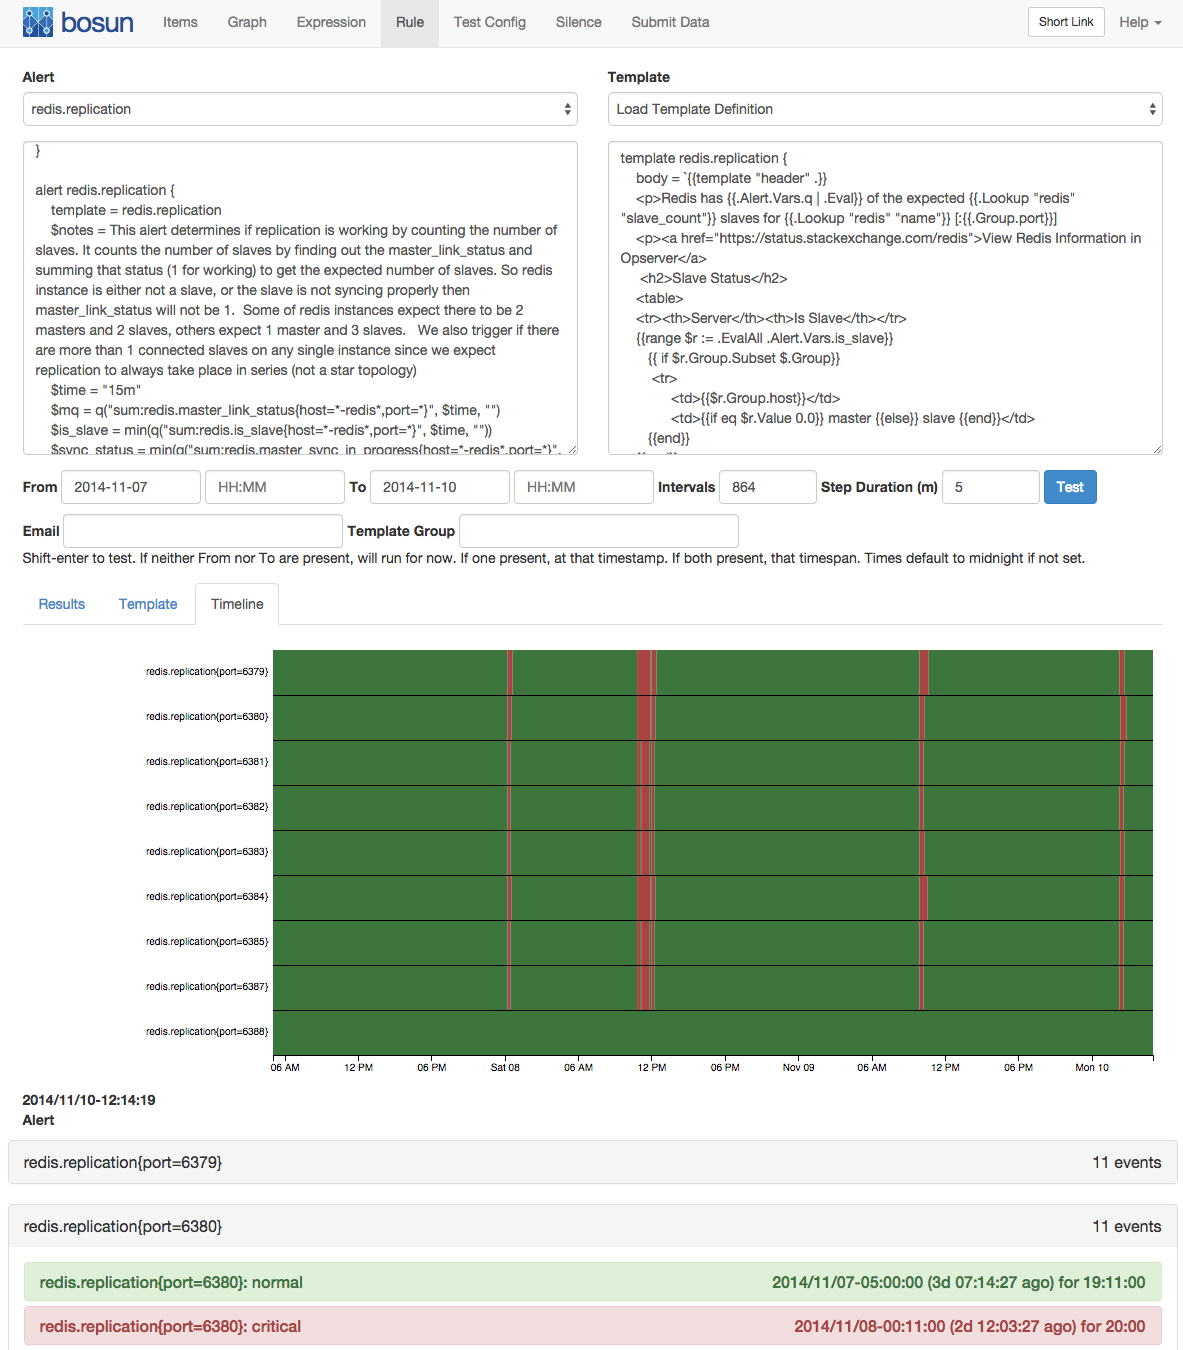
One of the reasons we've been chasing self-learning algorithms is that we have lost faith in the feasibility of a more direct approach. We can no longer imagine building and maintaining alerting rules because we have no system that provides powerful alerting, helps us keep oversight and streamlines the process of maintaining and iteratively developing alerting.I recently discovered bosun, an alerting frontend ("IDE") by Stack Exchange, presented at Lisa14. I highly recommend watching the video. They have identified various issues that made alerting a pain, and built a solution that makes human-controlled alerting much more doable. We've been using it for a month now with good results (I also gave it support for Graphite). I'll explain its merits, and it'll also become apparent how this ties into some of the things I brought up above:

- in each rule you can query any data you need from any of your datasources (currently graphite, openTSDB, and elasticsearch). You can call various functions, boolean logic, and math. Although it doesn't expose you a full programming language, the bosun language as it stands is fairly complete, and can be extended to cover new needs. You choose your own alerting granularity (it can automatically instantiate alerts for every host/service/$your_dimension/... it finds within your metrics, but you can also trivially aggregate across dimensions, or both). This makes it easy to create advanced alerts that cover a lot of ground, making sure you don't get overloaded by multiple smaller alerts. And you can incorporate data of other entities within the system, to simply make better alerting decisions.
- you can define your own templates for alert emails, which can contain any html code. You can trivially plot graphs, build tables, use colors and so on. Clear, context-rich alerts which contain all information you need!
- As alluded to, the bosun authors spent a lot of time thinking about, and solving the workflow of alerting. As you work on advanced fault detection and alerting rules you need to be able to see the value of all data (including intermediate computations) and visualize it. Over time, you will iteratively adjust the rules to become better and more precise. Bosun supports all of this. You can execute your rules on historical data and see exactly how the rule performs over time, by displaying the status in a timeline view and providing intermediate values. And finally, you can see how the alert emails will be rendered as you work on the rule and the templates
I haven't seen anything solve a pragmatic alerting workflow like bosun (hence their name "alerting IDE"), and its ability to not hold you back as you work on your alerts is refreshing. Furthermore, the built-in processing functions are very complimentary to graphite: Graphite has a decent API which works well at aggregating and transforming one or more series into one new series; the bosun language is great at reducing series to single numbers, providing boolean logic, and so on, which you need to declare alerting expressions. This makes them a great combination.
Of course Bosun isn't perfect either. Plenty of things can be done to make it (and alerting in general) better. But it does exemplify many of my points, and it's a nice leap forward in our monitoring toolkit.
Conclusion
Many of us aren't ready for some of the new technologies, and some of the technology isn't - and perhaps never will be - ready for us. As an end-user investigating your options, it's easy to get lured in a direction that promotes over-complication and stimulates your inner scientist but just isn't realistic.Taking a step back, it becomes apparent we can setup automated fault detection. But instead of using machine learning, use metadata, instead of trying to come up with all-encompassing holy grail of math, use several rules of code that you prototype and iterate over, then reuse for similar cases. Instead of requiring a paradigm shift, use a language you're familiar with. Especially by polishing up the workflow, we can make many "manual" tasks much easier and quicker. I believe we can keep polishing up the workflow, distilling common patterns into macros or functions that can be reused, leveraging metric metadata and other sources of truth to configure fault detection, and perhaps even introducing "metrics coverage", akin to "code coverage": verify how much, and which of the metrics are adequately represented in alerting rules, so we can easily spot which metrics have yet to be included in alerting rules. I think there's a lot of things we can do to make fault detection work better for us, but we have to look in the right direction.
PS: leveraging metrics 2.0 for anomaly detection
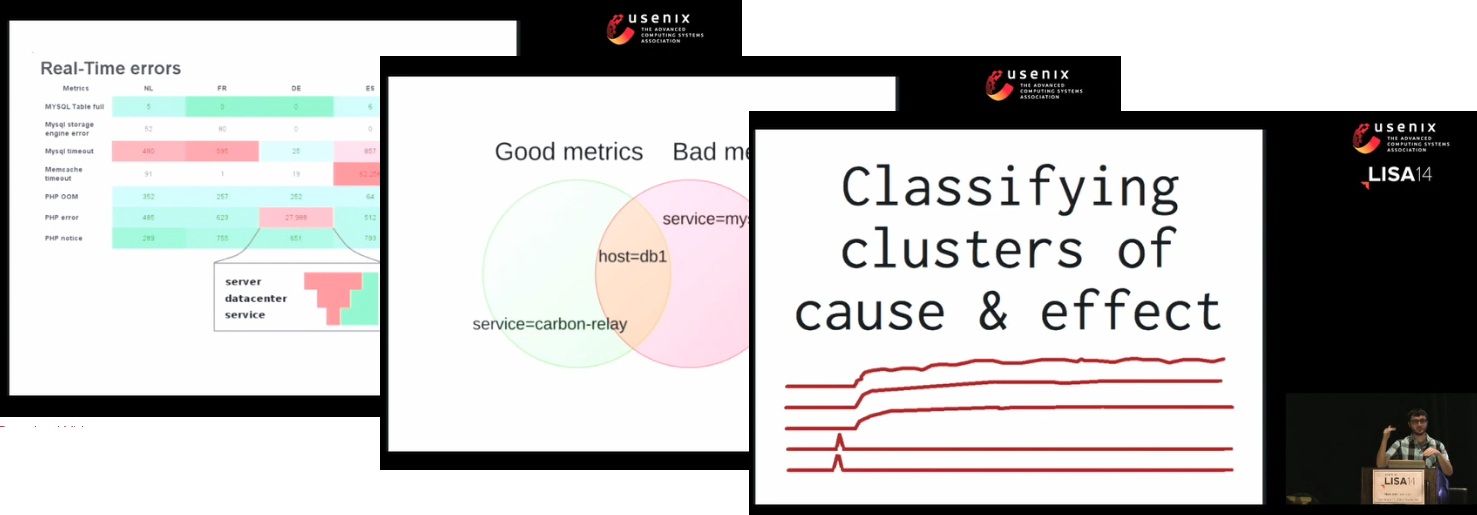
In my last metrics 2.0 talk, at LISA14 I explored a few ideas on leveraging metrics 2.0 metadata for alerting and fault detection, such as automatically discovering error metrics across the stack, getting high level insights via tags, correlation, etc. If you're interested, it's in the video from 24:55 until 29:40
@name